Projects
Featured Work
Power BI
Excel
DAX
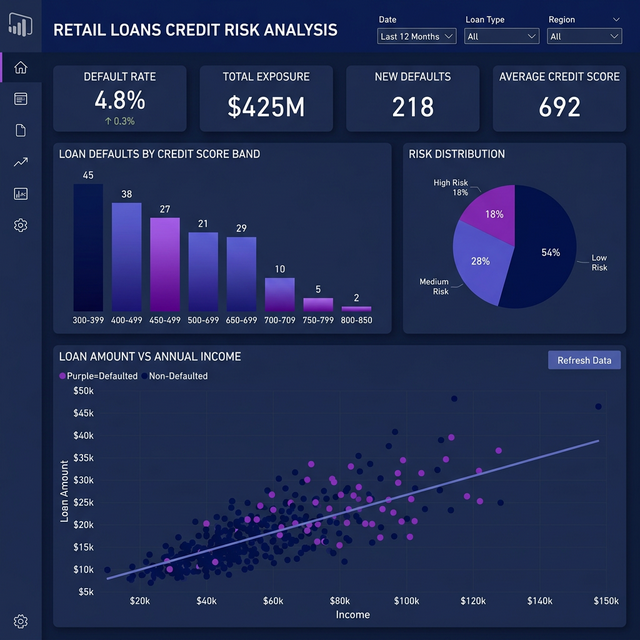
Credit Risk Analysis Dashboard
Analyzed retail loan data to identify high-risk borrowers and default patterns. Built an interactive dashboard surfacing credit score distributions, default rates, and risk segments.
GitHub Repository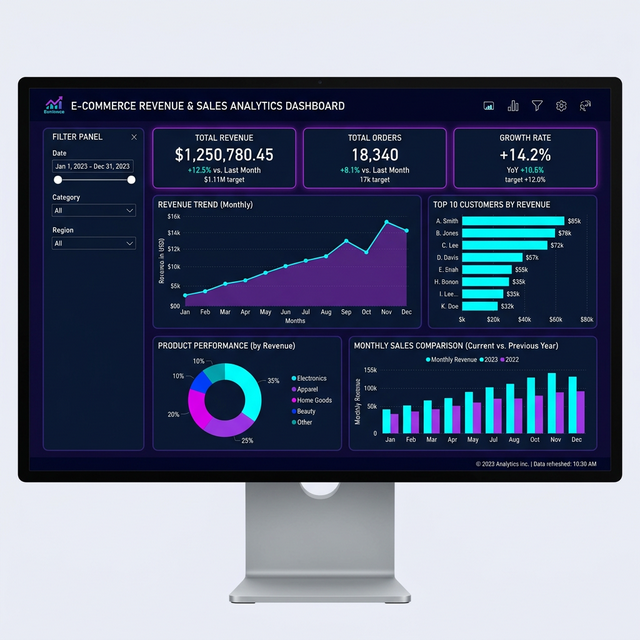
Power BI
CSV
DAX
E-commerce Sales & Revenue Analysis
Sales performance dashboard analyzing revenue trends, top customers, and product performance. Tracked monthly KPIs and highlighted growth opportunities across segments.
GitHub Repository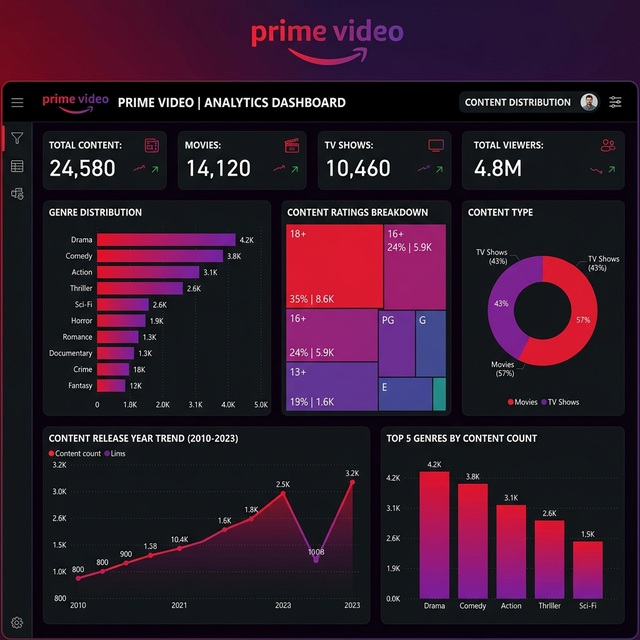
Power BI
Excel
Prime Video Analytics
Analyzed streaming content data to study genre distribution, ratings, and release trends. Visualized content diversity and audience preference patterns across thousands of titles.
GitHub Repository